Tejal Wakchoure
data and graphics reporter
Hi! I'm Tejal. I'm a data and graphics reporter at NBC Local. Previously, I managed newsroom products at The Baltimore Banner and studied a mishmash of journalism and computer science at Columbia, MIT and BITS Pilani. More 👾


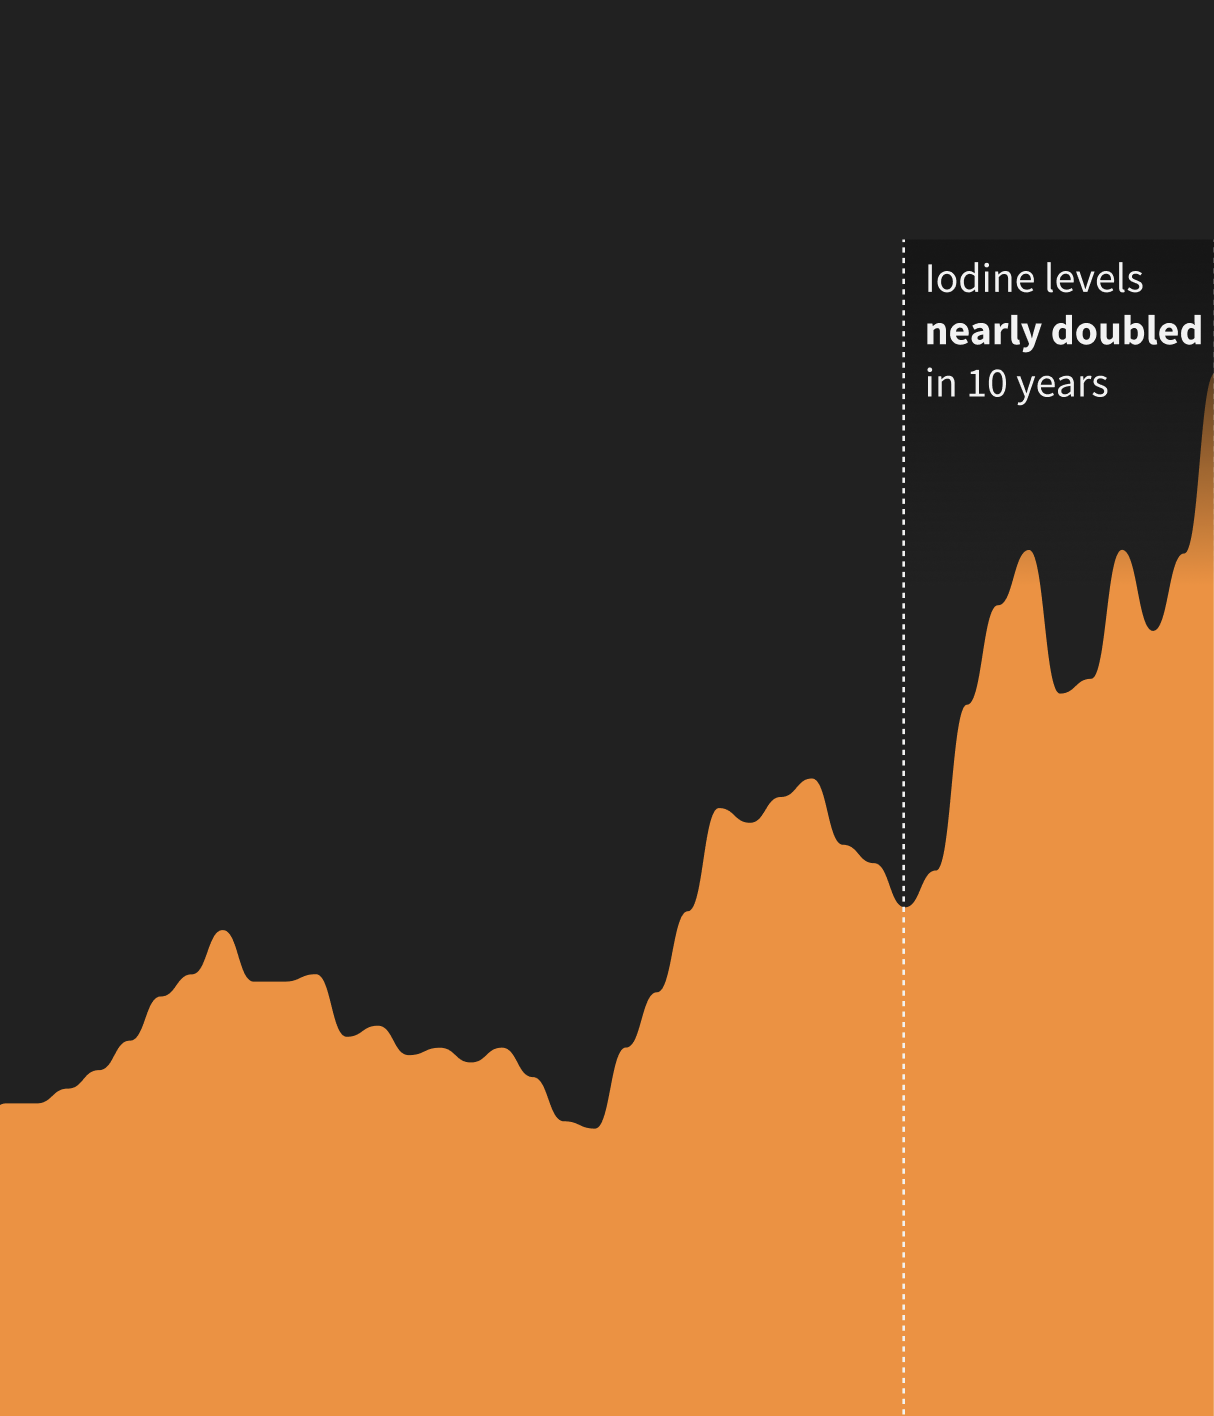
Global iodine levels to reach record high by 2050, threatening ozone layer
Tracing the rise of iodine in the atmosphere and its impact on the delicate climate of the Arctic region.
data story

New York, New York
A musical wordle of songs named after places in the city! Made entirely in JavaScript and Mapbox.
data story
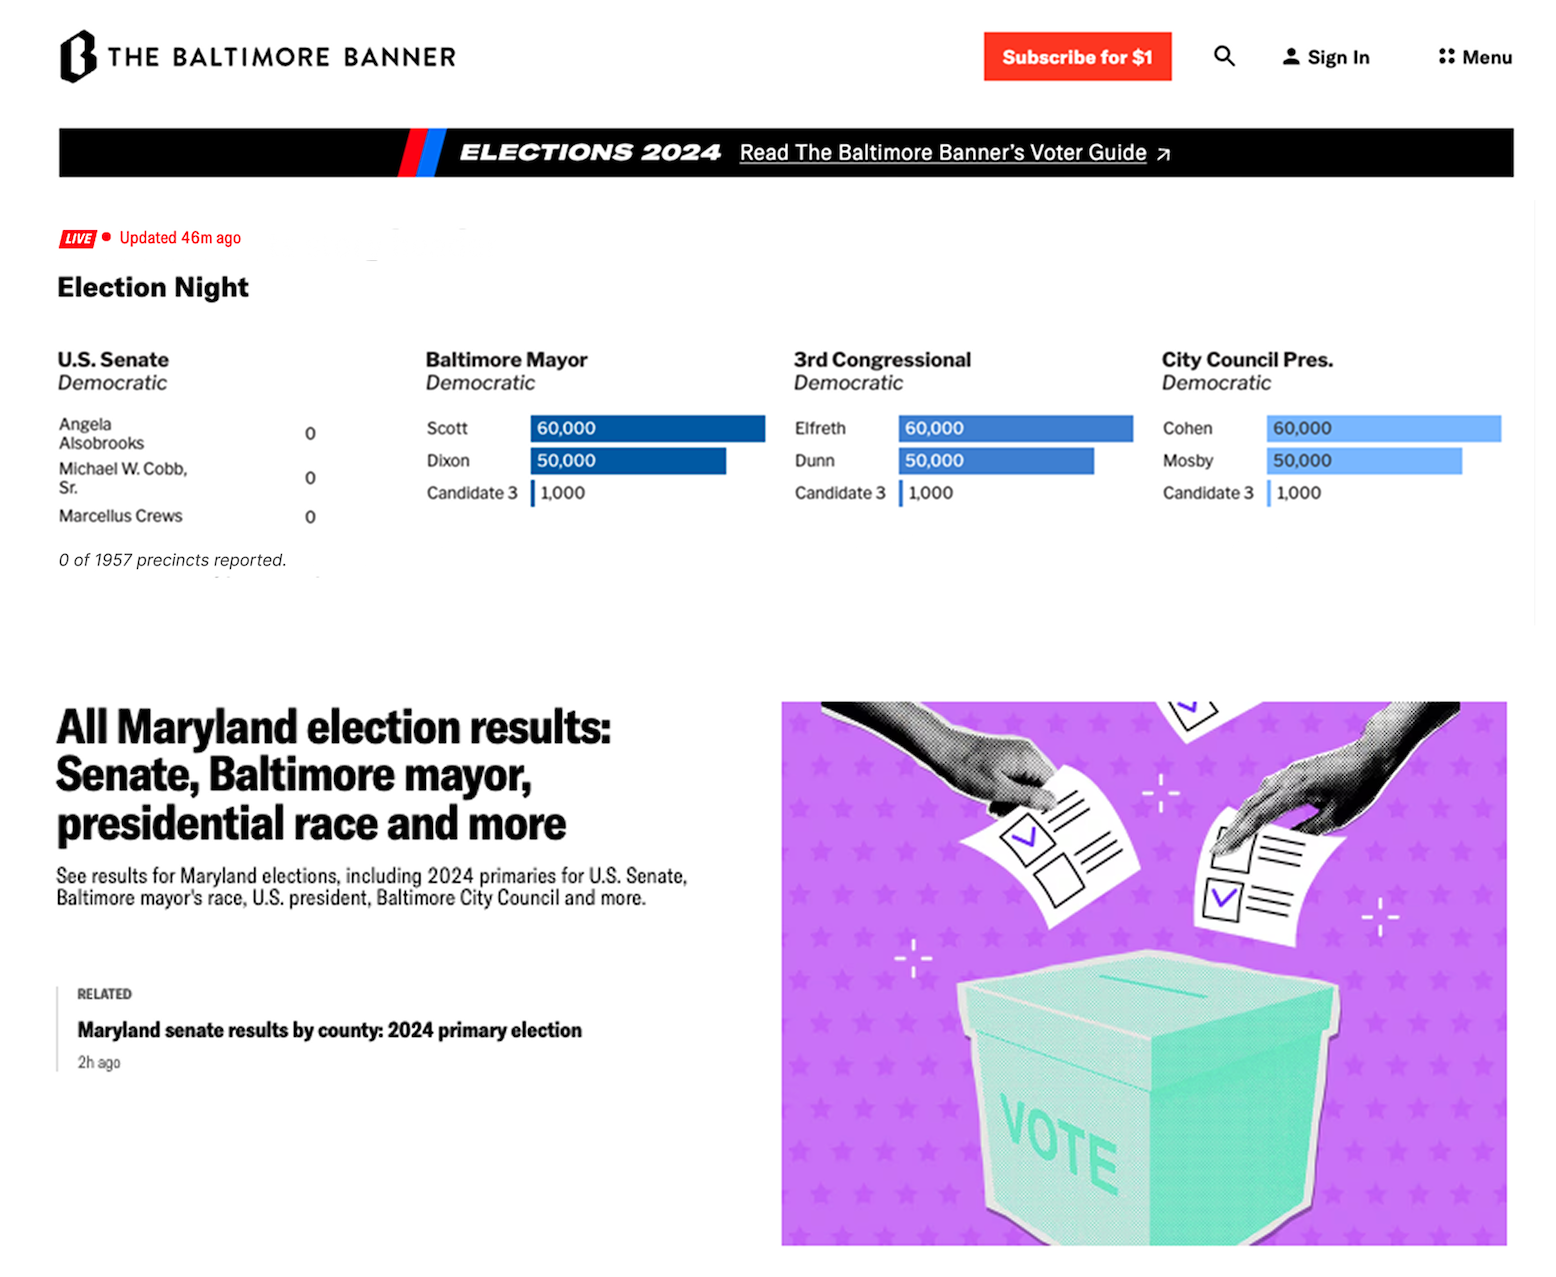
Elections 2024
Created homepage visuals and a voter guide for the 2024 Maryland Primary and General Election.
data story
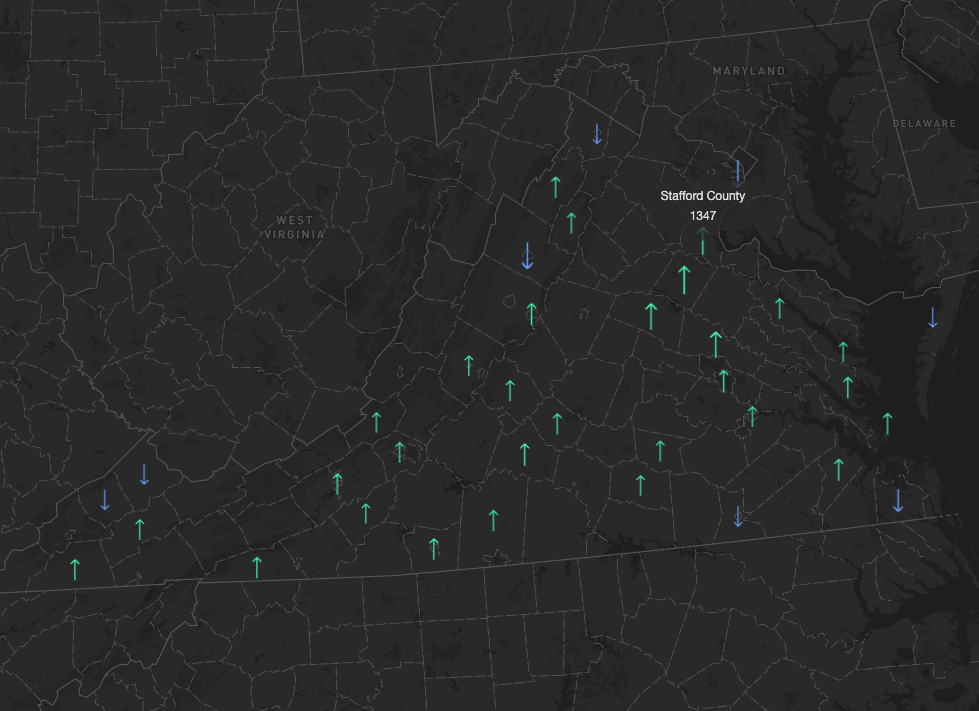
Virginia sees an influx in state-to-state migration for the first time in four years
Exploring annual US domestic migration patterns using a scrolly map.
data story
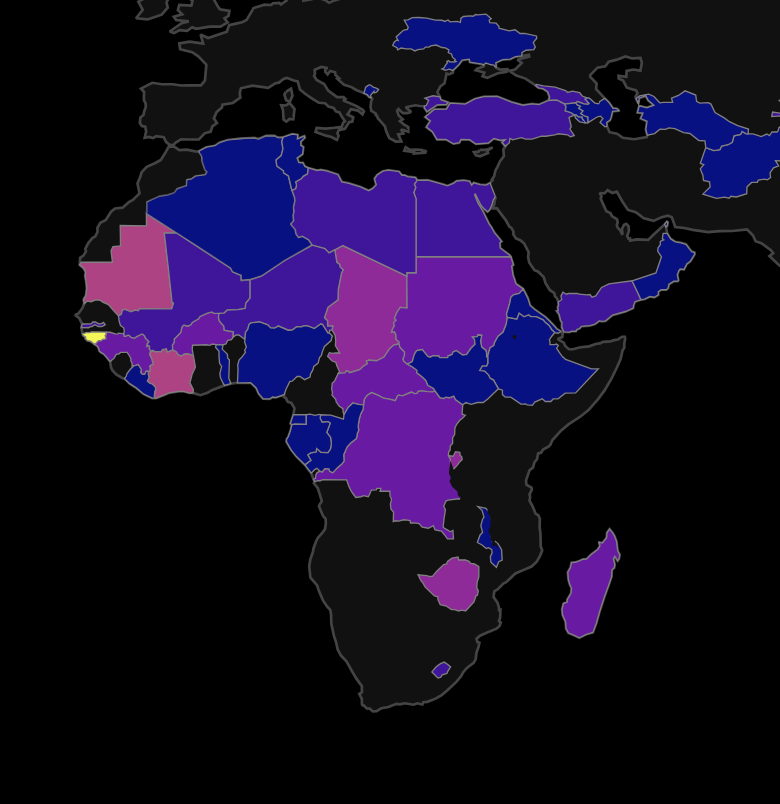
Guinea-Bissau's latest coup attempt is only one of 10 since 2000
Only one elected president in Guinea-Bissau has ever completed a five-year term in office. An investigation into the country's history of political unrest, visualized in D3.js.
data story
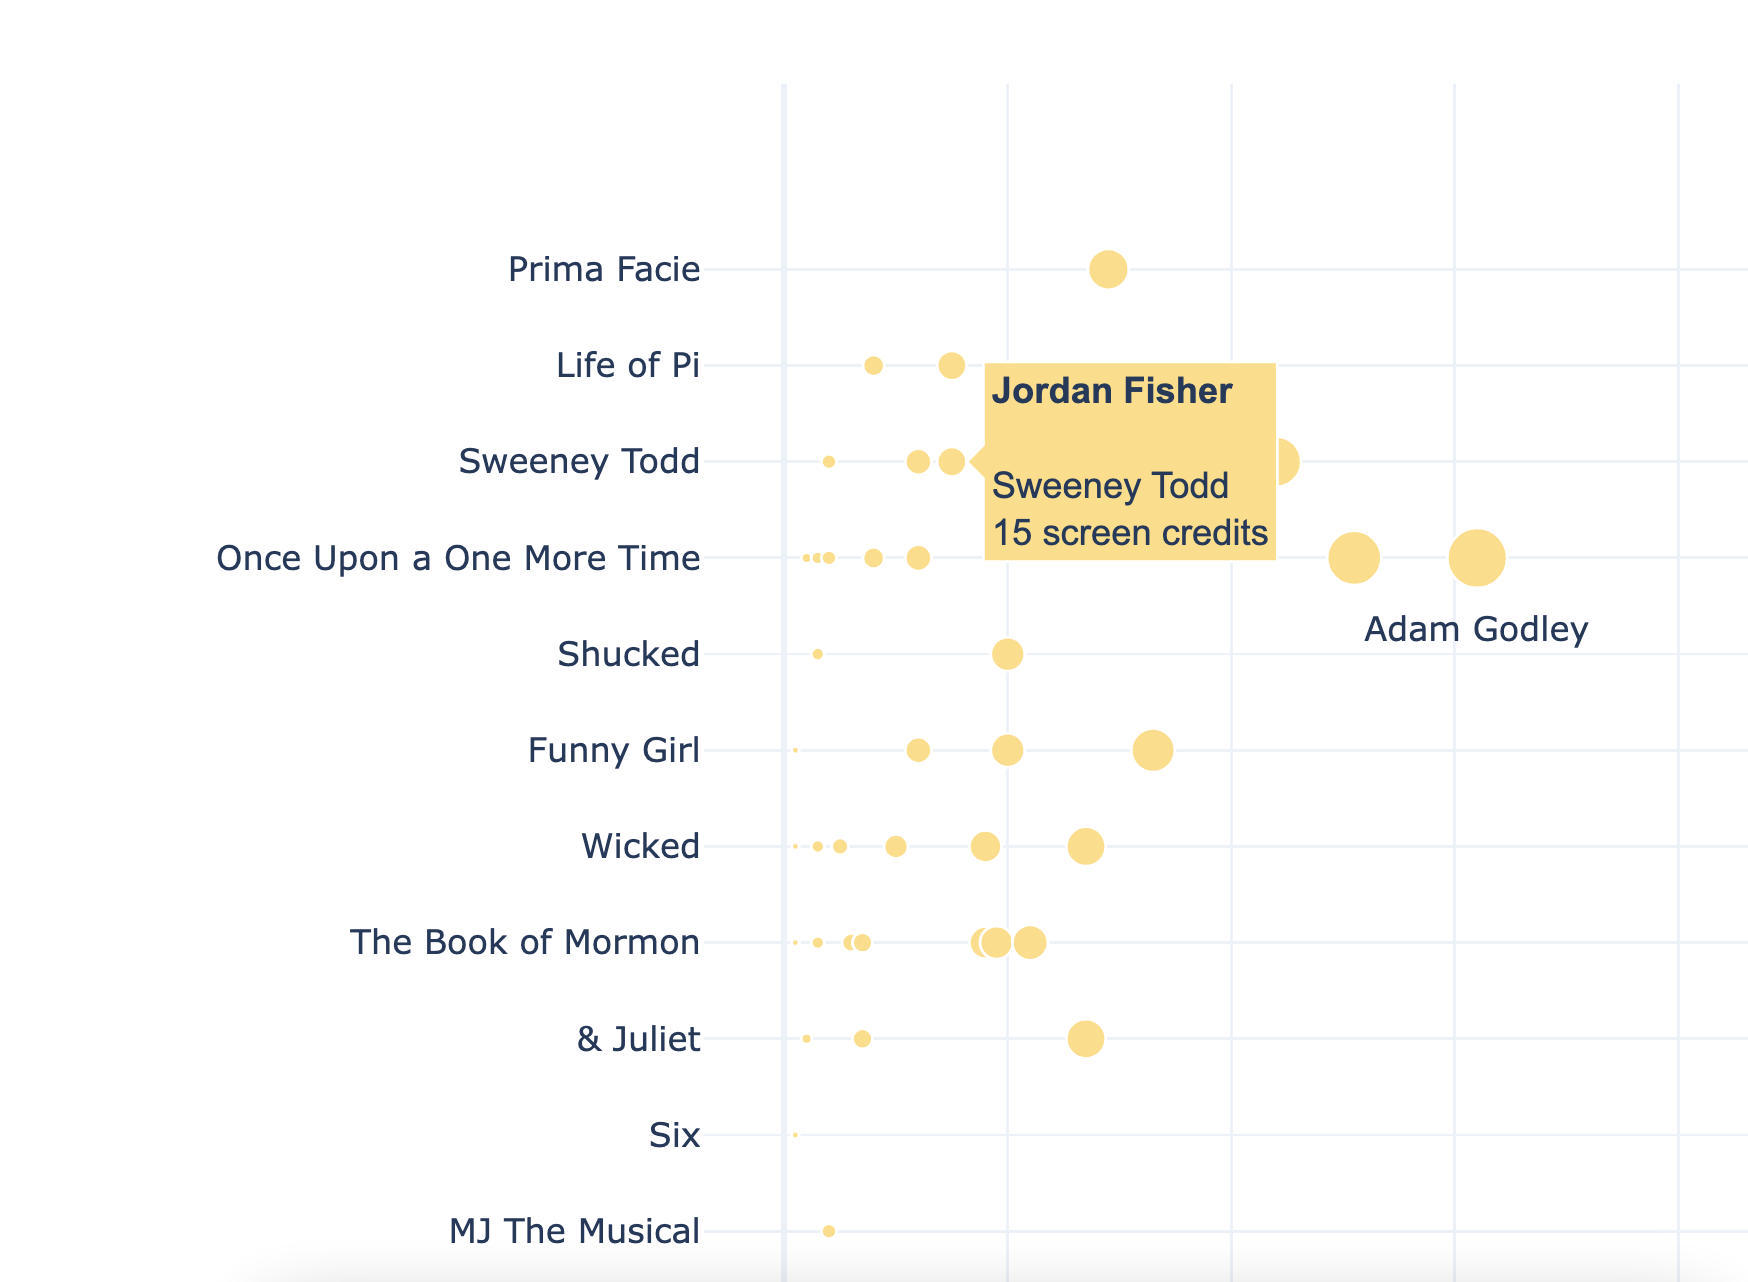
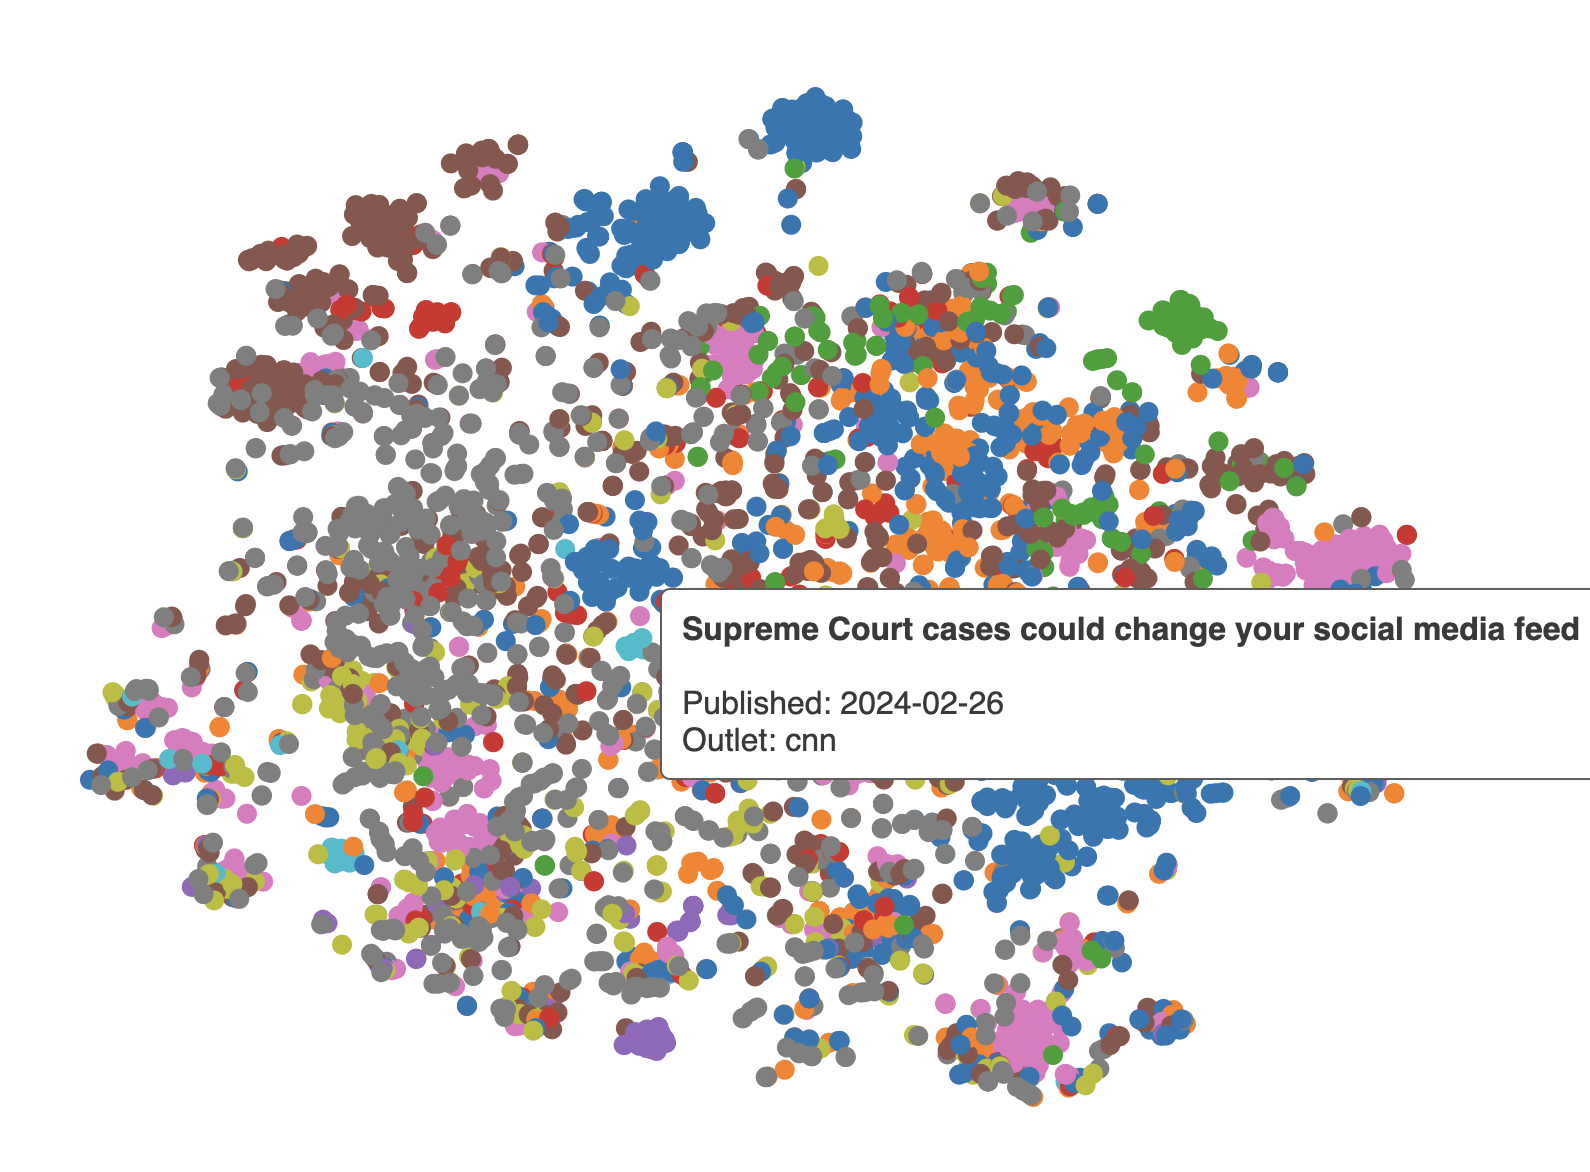
A week of stories in LLMs
An exploration of stories published by multiple outlets over a week using large-language models and D3.js.
data story
SuperGlue
Built a computational journalism tool at MIT for nonverbal language analysis on broadcast news.
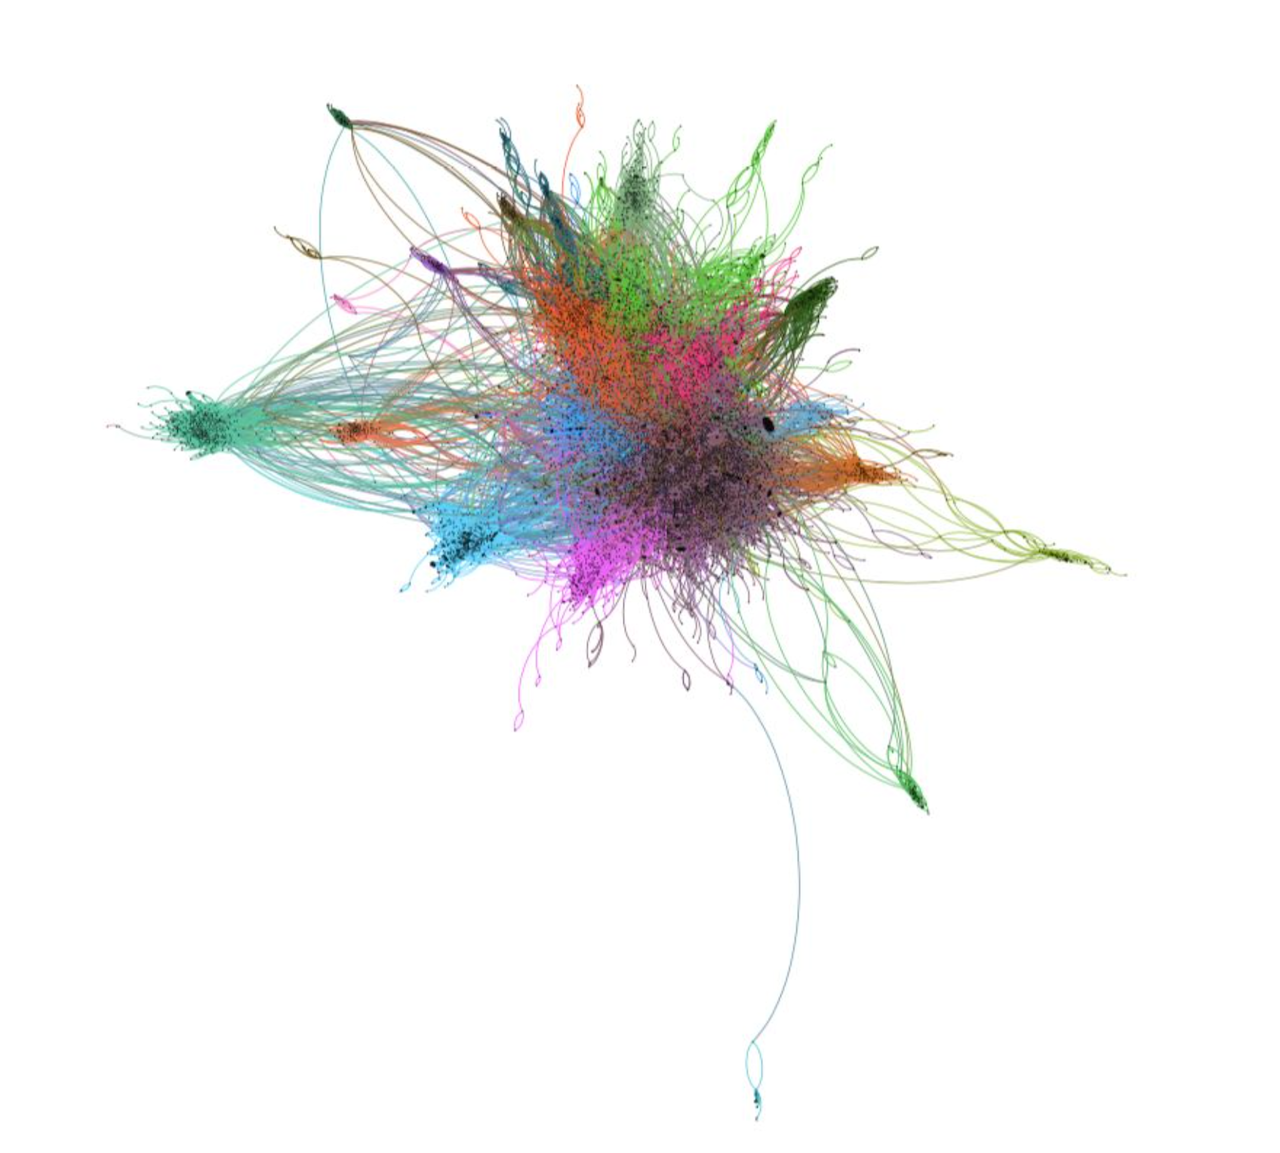
Interpreting chat networks
A study on the community dynamics of internet forums. Mined data in Python, mapped it in Gephi and developed a web app in Python to interact with the results.

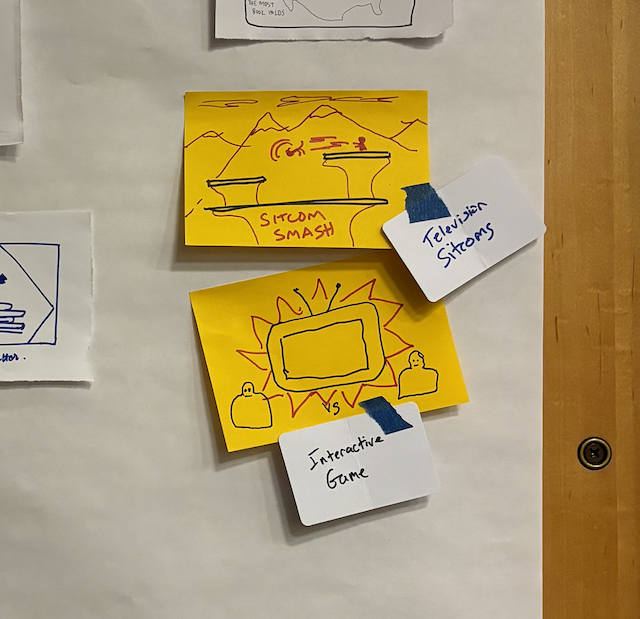
Love Letter
User interface design and React.js implementation of a board game during the pandemic :)

Six in 100 children still die in Sub-Saharan Africa
Visualizing World Bank data for child mortality rates.
data story
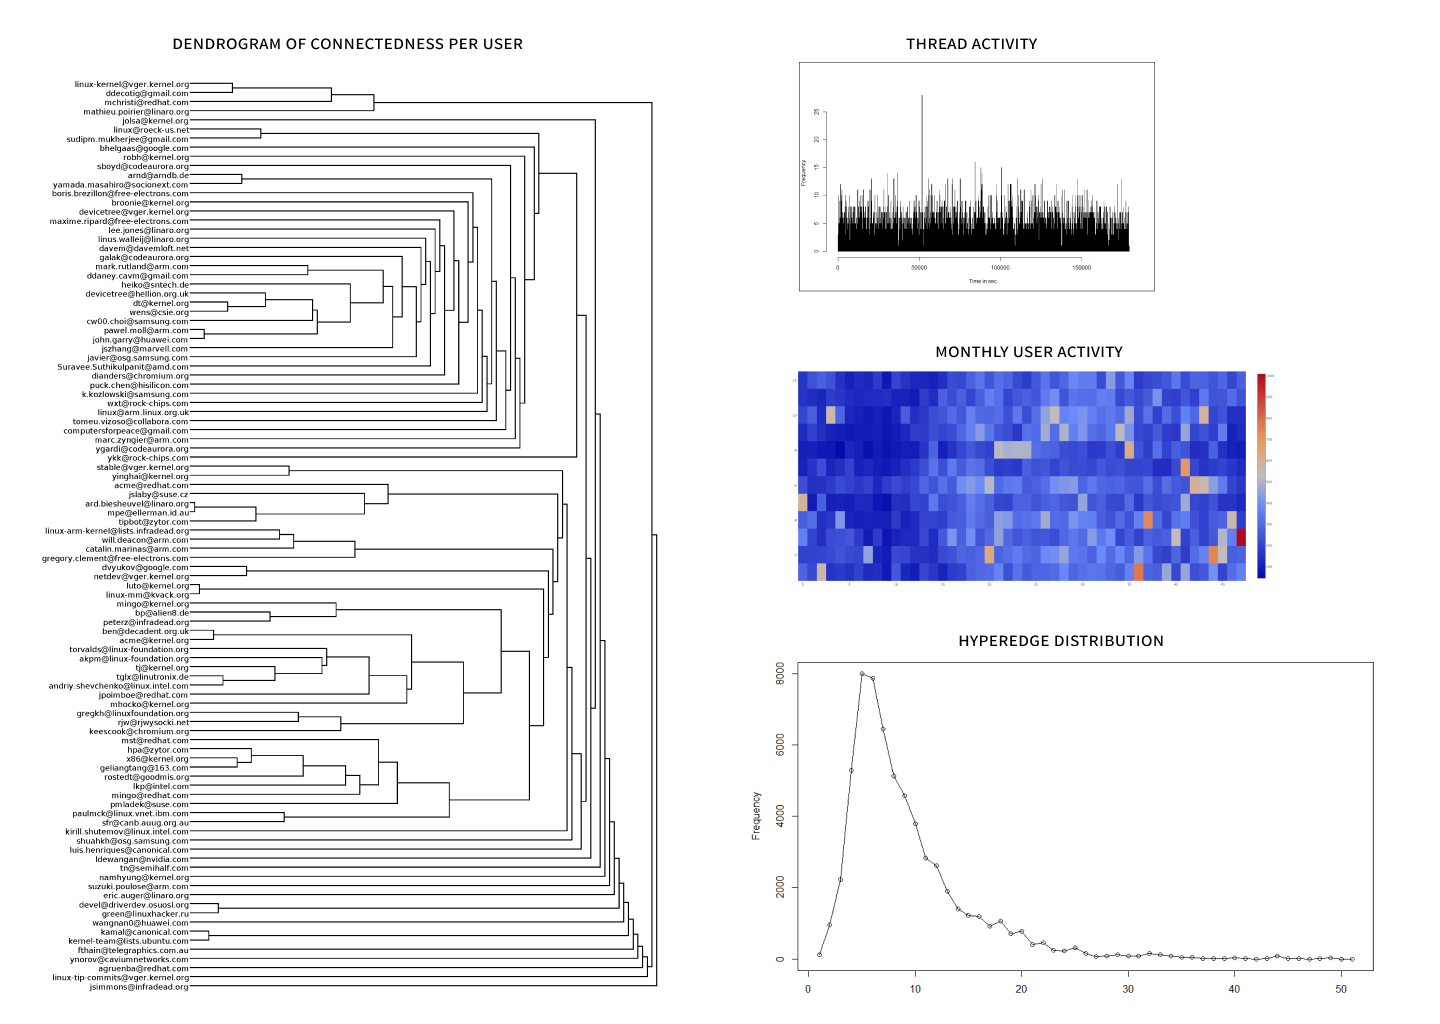
Mailing list analysis tool for community pattern detection
A parser that analyses structures and patterns in mailing list communication.
Ideas and more!
Ideas, designs, and visualizations.